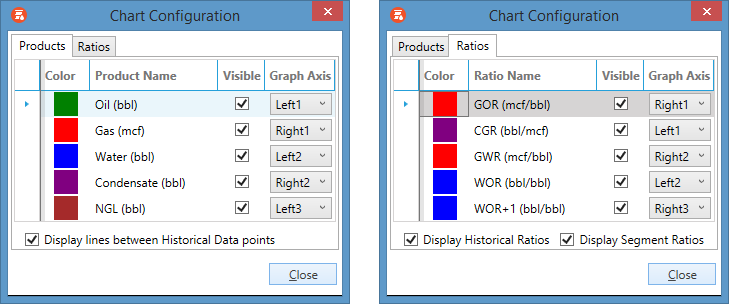
Chart configuration
You can configure the appearance of product and ratio types in charts using the Chart Configuration dialog. To
open the dialog, click the Chart button  on the Home tab of the ribbon. Click the Products or
Ratios tab as needed. The editable configuration fields are explained in the table below.
Products and ratios, and their general configuration (including the display colors), can be created and edited in the Decline Product and Ratio configuration, which can be accessed in the Reserves Configuration workspace.
Note: Apart from WOR, only one ratio can be displayed per product.

| Field | Description |
|---|---|
| Visible | Check this box to display the product or ratio on the chart; unchecking it removes the product or ratio from the chart. |
| Graph Axis | Position of the Y-axis. You can choose from five left-hand side positions (Left1 to Left5) and five right-hand side positions (Right1 to Right5). |
| Display lines between Historical Data points | Connects chart points together by drawing lines between them (Products configuration). |
| Display Historical Ratios | Shows ratio curves for historical data (Ratios configuration). |
| Display Segment Ratios | Shows ratio curves for forecast segments (Ratios configuration). |
